AI News · Tools
Saving Tokens in Claude Code:
What actually helps.
DE Auf Deutsch lesen
When coding with an agent, token costs pile up in several places: in the code it generates, in finding the right file, and in long tool output. I tested Ponytail, Graphify and RTK on the same project. All three help, but not in the same way and not for every task.
A coding agent works with whatever sits in its context window: project instructions, files it has read, tool output, and conversation history. The more of that gets processed for a given request, the higher the input costs usually are. Prompt caching and automatic compaction change the arithmetic, but they don't remove it.
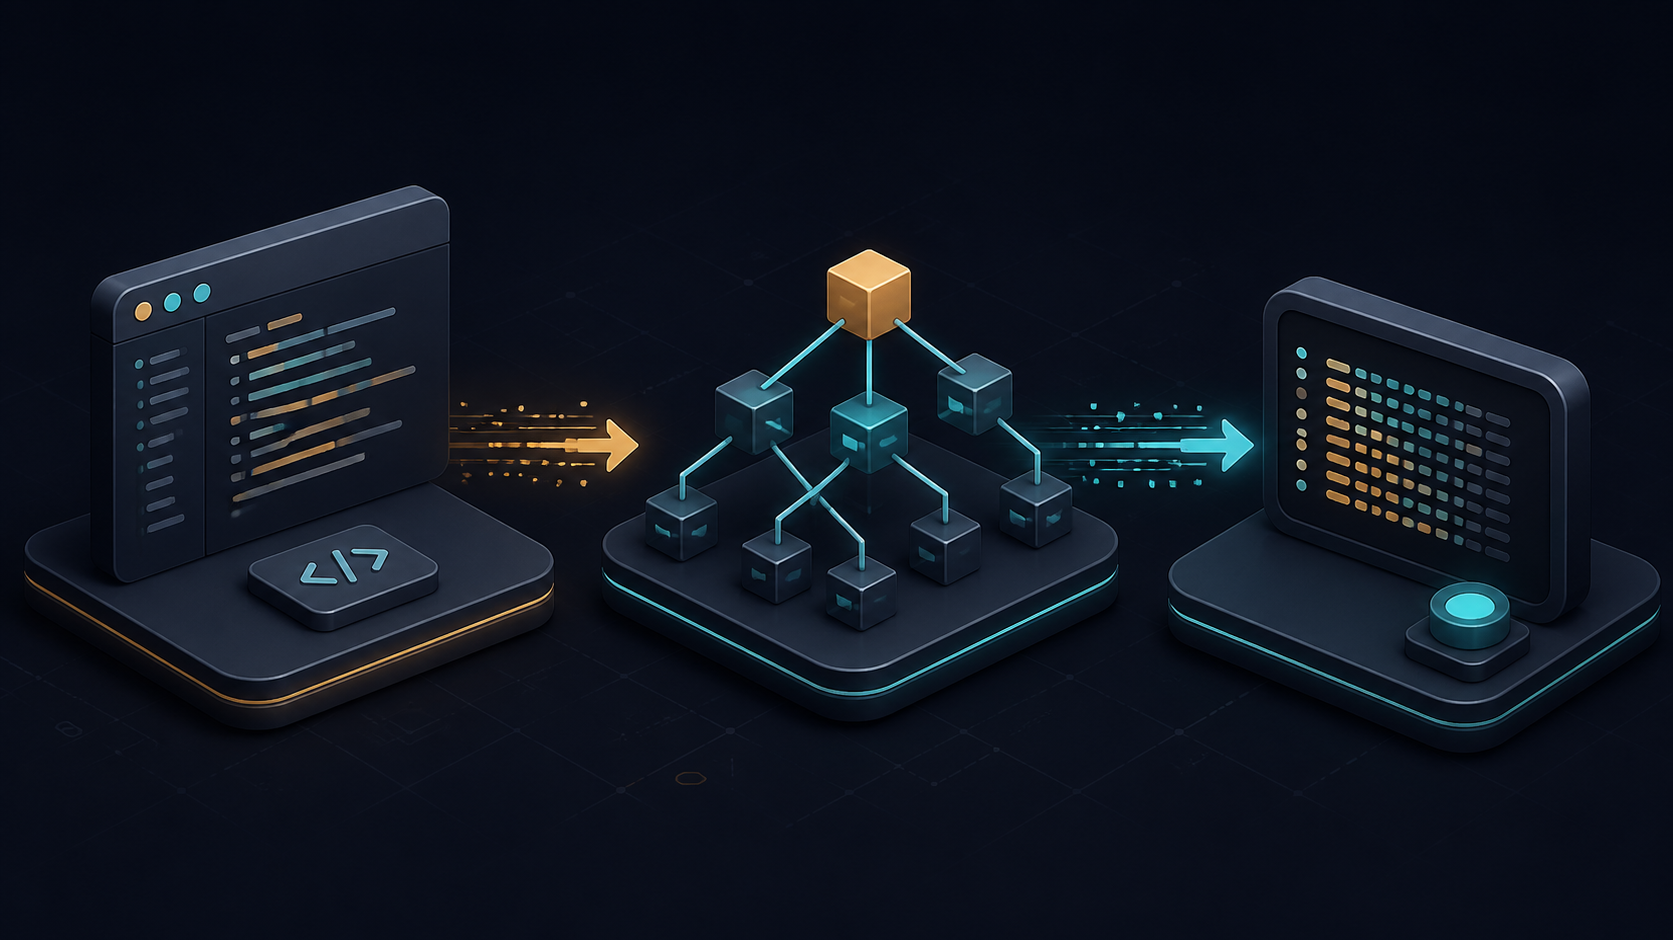
That's why the three tools in this post intervene at different points. Ponytail is meant to prevent unnecessary code. Graphify is meant to shorten the search through the repository. RTK reduces development-tool output before it reaches the agent.
Three measurements, three different tasks
The bars aren't a ranking. Each one measures a different part of the workflow.
The three approaches compared
| Tool | Targets | Saves | Effort | Measured |
|---|---|---|---|---|
| Ponytail | How much code the agent writes | Output tokens | Install a skill | −43 % (net) |
| Graphify | How the agent finds code | Input tokens spent searching | Build and maintain an index | −96 % (targeted) |
| RTK | How much tool output comes back | Input tokens from tool calls | One-time hook setup | −89 % (47 cmds) |
The tools can be combined, since they affect different parts of the workflow.
Ponytail: getting the agent to write less code
The "lazy senior developer" as a skill
Ponytail on GitHub · a skill for Claude Code, Codex, Cursor, Gemini CLI and others
Ponytail is a skill file with a short checklist. Before writing anything, the agent is meant to check whether the function already exists, can be solved with a standard function, or is even needed at all. As soon as a simple solution suffices, the search stops.
The result is fewer output tokens and less code that later needs maintaining. Unnecessary code usually costs more over its lifetime than it did to write.
And this is where it gets interesting. An independent test shows a very mixed picture:
- Large, open-ended task ("build an admin dashboard"): 101 instead of 464 lines of code, 3.6K instead of 8.4K tokens. A clear win.
- Small, tightly scoped tasks (user auth, CSV export, rate limiting): no benefit, sometimes a loss. For the auth task it was 6K instead of 2.3K tokens, i.e. more than without it, because the agent additionally reasons through the Ponytail ladder.
Another test on a FastAPI/React project found 54% less code with 22% fewer tokens and 20% lower costs. That matches my own result: Ponytail helps mainly on tasks where an agent would otherwise over-build. On a precise ticket, the extra checklist is more overhead than benefit.
Measured again: the ladder on a real task
The task on PlantWiz was: "CSV export of the plant list." A typically terse ticket. I picked it deliberately so the ladder would get nothing handed to it: the project had no CSV code at all, no suitable library, nothing to reuse. Ponytail could only trim here, not cut away. I implemented the task twice, once straightforwardly, once with the ladder.
| Result | Without Ponytail | With Ponytail | Difference |
|---|---|---|---|
| New files | 6 | 1 | −5 |
| Lines of code | 569 | 104 | −81.7 % |
| Characters | 18,059 | 3,539 | −80.4 % |
| Output tokens (≈) | 4,515 | 885 | −80.4 % |
The version without the ladder built what a thorough developer typically builds: a type file
with an options object, an RFC-4180 serializer, a column definition with ten selectable fields,
a composable with localStorage persistence, a modal with column selection,
delimiter and date options with a live preview, plus 103 lines of tests. None of it is wrong.
None of it was requested either.
The version with the ladder landed on rung 4 (native platform feature?): a
Blob and an anchor element. No library. What remained was 44 lines in a composable,
a button next to the existing PDF export, and one test for the one genuinely tricky part: quoting
semicolons and quotation marks. The formula-injection hardening against CSV injection stayed in,
because Ponytail explicitly exempts security measures from trimming.
The cost: the ladder costs something even when it finds nothing
There's a second point that's hard to put a number on: the trimmed version is poorer. No delimiter switch, no column selection. If someone asks for a comma export the day after tomorrow, it gets rebuilt. That rebuild costs tokens again. Ponytail is betting that the question usually won't come. That bet is usually right, but it's a bet, not a saving.
For openly worded tasks, roughly 40% net is realistic; for precise tickets the effect can be zero or slightly negative. The 465 lines not written also never need to be maintained, read, or migrated later.
GET/PUT /admin/user-plans and a complete 93-line user tab in
AdminView.vue. Half the task was already done, nobody just remembered. The version
without the ladder built it a second time without comment. As a data point it's worthless. It's
an outlier on the high side, but a useful argument for the ladder.
Graphify: searching code as a graph
A knowledge graph instead of grep
Graphify on GitHub · graphify.net
Graphify parses a project locally with tree-sitter (around 40 languages) and builds a queryable knowledge graph from it: files, symbols, dependencies and the relationships between them. Instead of searching through files, the agent can query the graph: what depends on this function? What path leads from A to B?
Technically it's cleanly solved: the graph lands as graph.json in the project, no
vector database needed. Every edge carries metadata on whether it was found directly in the
source (EXTRACTED) or inferred from dependencies (INFERRED). That
honesty about its own certainty is rare and welcome.
Two limitations worth knowing about:
- The graph is a derived artifact. It goes stale as soon as the code changes. An index that lags behind reality misleads the agent with confidence.
- The documentation part costs API calls. Code analysis runs entirely locally. Semantic extraction from PDFs and documentation needs an API key, and therefore money. For a large document set that's an ongoing cost.
Measured again: orientation in the admin area
Building the index on PlantWiz took 38 seconds for 258 code files and
produced 2,014 nodes, 2,994 edges and 179 clusters. The graph.json is 1.7 MB. The
agent never reads it in one piece; it queries it.
Same task, same question: which files do I need to touch, and how are they connected? Once done classically with search and read, once via the graph:
| Approach | Calls | Context |
|---|---|---|
| Classic: grep + read files | grep -rln · admin.ts · AdminView.vue | 63,241 B |
| Graphify: targeted query | explain admin.ts · explain AdminView.vue | 2,552 B |
| Savings | −96.0 % |
The reason for the gap is mundane: AdminView.vue has 1,323 lines and 51 KB. Anyone
who wants to know what's in it normally reads all of it. graphify explain delivers,
for 1,948 bytes, the list of all 58 symbols it contains with line numbers. That's enough to
decide which 40 lines you actually need.
The cost: two gaps worth knowing about
graphify query "admin area user
    management"
returned 6,498 bytes, including plantPairs.ts, a file about
plant neighborhoods where the words admin, user and garden appear not once. The hit came
from fuzzy name matching. If you already know the symbol name, explain gives
excellent answers. If you're searching for it, you get noise — exactly when you'd need the graph
most.
graphify path "AdminView.vue"
    "gardens.ts"
responds: No path found. Yet the component demonstrably calls the
admin API, just via fetch() over HTTP. No static analysis sees that edge. In a
full-stack project you therefore end up with two disconnected graphs instead of one: frontend
and backend. For the common question "which backend does this form talk to?", the graph doesn't
help.
Two smaller issues from the log: 27 .sql files contributed nothing because
tree_sitter_sql isn't bundled. On PlantWiz, with a 4 MB init.sql, that's
half the data model. And 11 more files produced exactly zero nodes.
Graphify pays off once a project moves beyond a prototype, but with realistic expectations. It
explains a known file excellently and helps less with finding that file in the first place. In
my measurement, searching by filename first and then calling explain was the
cheapest path. Anchor the index rebuild in a pre-commit hook or CI so the graph stays current.
RTK: condensing tool output
Rust Token Killer
RTK is the least spectacular of the three and, in my view, the most convincing. It's a CLI proxy that condenses the output of common developer commands before it reaches the agent: repetitions get collapsed, files and errors get grouped, long output gets trimmed.
It happens transparently via a PreToolUse hook: git status is automatically
rewritten to rtk git status. You don't notice it day to day. Over 100 commands
are covered: Git, test runners, build tools, package managers, Docker, Kubernetes. The vendor
claims 60-90% savings, up to −90% for cargo test.

rtk
(Rust Type Kit). If rtk gain doesn't work after installing, you have the wrong
binary. Check with rtk --version.
Why RTK pays off fastest: it's the only one of the three measures that requires no behavior change and leaves no artifact to maintain. Set it up once, then it works in the background. And it targets exactly where the most context gets burned in practice: test output and build logs.
Measured again: 47 commands in daily use
Vendor figures are vendor figures. So I cross-checked RTK 0.43 against a production project: PlantWiz, a Vue 3 application with a Node backend, around 45,000 lines of TypeScript and Vue, 327 unit tests. Each command run once raw and once through RTK, measured in bytes of output:
| Command | Raw | With RTK | Savings |
|---|---|---|---|
| vitest run (327 tests) | 7,719 B | 20 B | −99.7 % |
| git diff HEAD~3 HEAD | 467,163 B | 44,026 B | −90.6 % |
| ls frontend/src | 888 B | 166 B | −81.3 % |
| git status | 705 B | 282 B | −60.0 % |
| find *.vue | 1,265 B | 556 B | −56.0 % |
| deps (package.json) | 1,073 B | 482 B | −55.1 % |
| git log --oneline -30 | 1,272 B | 1,272 B | ±0 % |
| grep -rn "fetch(" | 1,175 B | 1,175 B | ±0 % |
Across every command run in the project, rtk gain reports, after 47 calls,
an estimated 149,000 tokens saved out of 167,300 raw tokens, or 89.1%.
RTK derives the token figure from output bytes. For this project the value therefore sits at the upper end of the vendor's stated 60-to-90% range.
Three observations. First: the gain is extremely unevenly distributed. A single
git diff accounted for 106,000 of the 149,000 tokens saved. Second: for commands
that are already compact, such as git log --oneline or a grep with few hits, nothing
happens — RTK passes them through unchanged. No harm, but no benefit either. Third: the effect is
largest exactly on the output you'd read completely least often anyway. Test runners and build
logs are 95% formatting.
The cost: information gets lost
Three places where I noticed this concretely during measurement:
- The test run shrinks to one line. 79 lines of Vitest output become
PASS (327) FAIL (0). What's lost isn't just color codes: the raw output contained astderrblock from a test logging a network error. Harmless in this case. An agent that only sees the one line can no longer notice real warnings, deprecation notices, or conspicuously slow tests. - The diff loses its structure. The condensed version drops hunk headers and,
in part, the
+/−markers; what remains is code lines with no recognizable attribution, ending in[530 more lines]. That's enough for an overview. Not enough for "was this line added or removed?" - Metadata disappears entirely.
rtk lsdelivers names and sizes, but no modification dates and no permissions. Anyone who wants to know which file was touched last has to ask again and pays for the second call.
The workaround is simple, you just have to know it: RTK is right for the normal case and wrong
for debugging. If a test is red and the agent is going in circles, the raw output belongs there.
rtk proxy <command> bypasses the filter. Skip that and you risk the worst of
all outcomes: an agent guessing off a summary, burning more tokens than the filter ever saved.
What to check before installing anything
These habits cost no extra tool and often cut more context than a new hook.
1. Clear the context deliberately
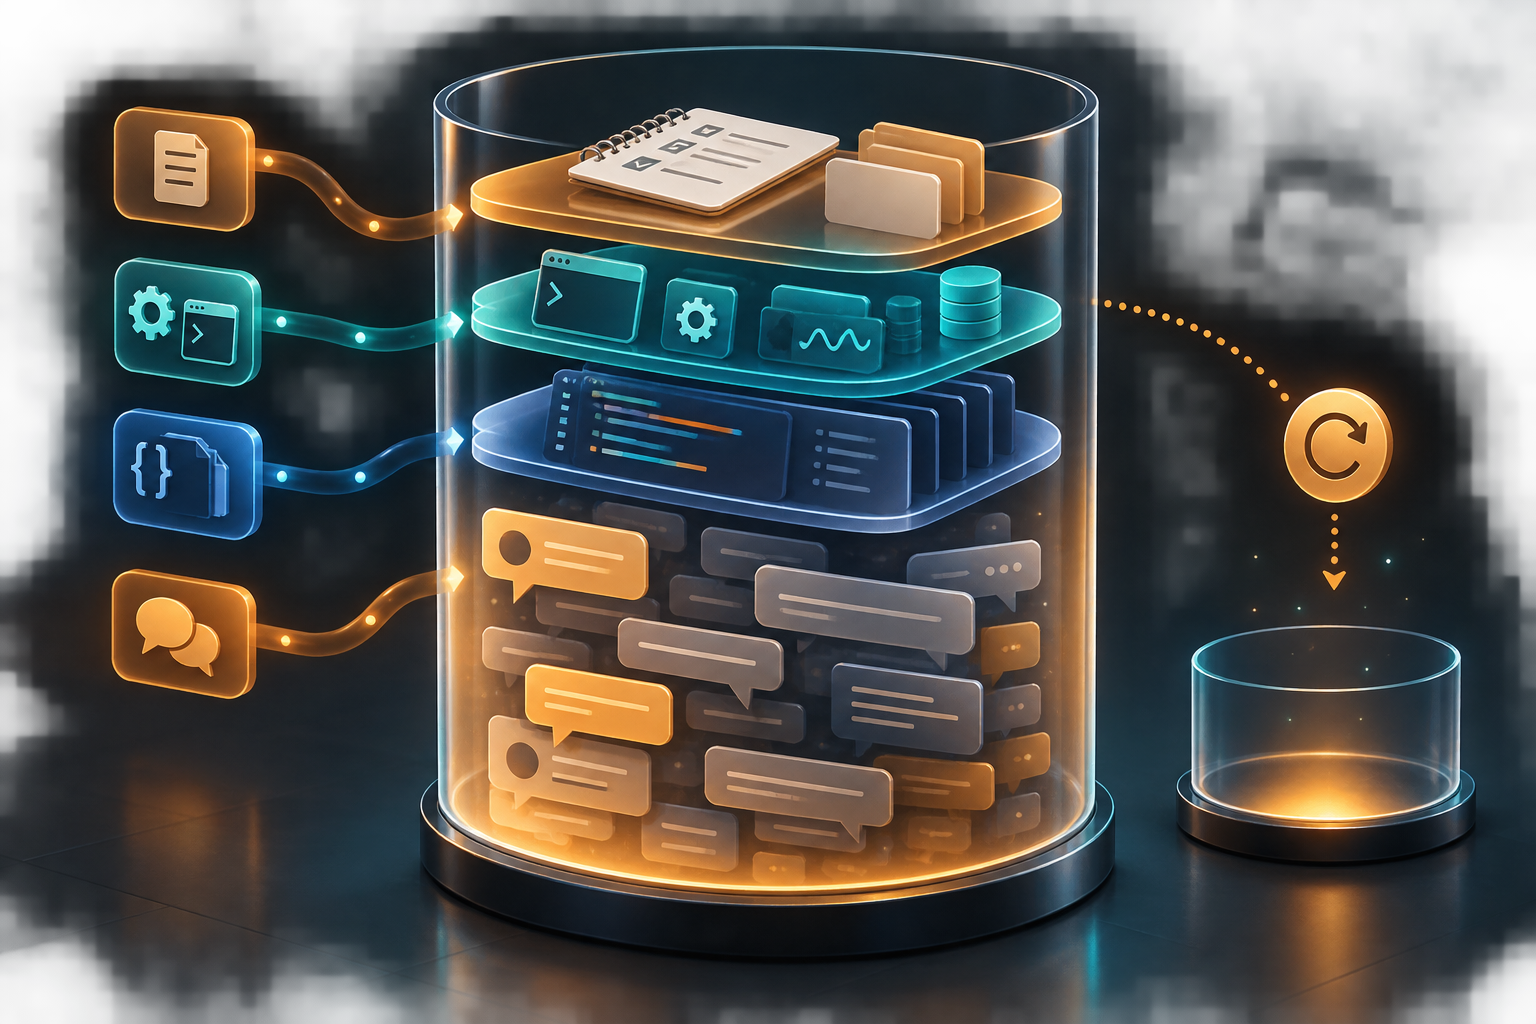
A long session also contains earlier attempts, files that were read, and tool output. That can
raise the cost of every further request and make orientation harder. For independent tasks, a
fresh context via /clear is worth it; for an ongoing task,
/compact can be the better choice.
2. Load MCP servers deliberately
Check with /context which MCP tools actually take up context. With
Tool Search
enabled, Claude Code loads only tool names by default and fetches full definitions only when
needed. Servers with alwaysLoad, disabled Tool Search, or verbose descriptions can
still take up noticeable space. Disabling servers you don't need remains sensible, but it's not
a blanket token-saving trick.
3. Delegate searches
When a question touches many files, a subagent can take over the research. It works in its own context window and returns only the result. That saves context in the main thread, but costs an extra agent call. For a simple search that's often too much; for an extensive survey it can pay off.
4. Pick the right model
Not every task needs the strongest model. Renamings, formatting, simple text changes get handled by a smaller model at a fraction of the cost. The trick is making the switch a habit.
5. Plan first, then build
Plan mode looks like a detour, but it's often the shorter route. An agent that heads off in the wrong direction and has to be walked back costs a multiple of the tokens an alignment step would have cost upfront.
6. Keep project instructions short
Global instructions get loaded at the start of every session. Keep them short enough to be
useful on every task. Detailed procedures belong in files the agent reads only when needed.
Check with /context what actually got loaded in your setup. The official
context view
shows what content gets added at which stage.
A sensible order
The tools complement each other. I'd check them in this order:
- Check your own context. Use
/context, close out independent tasks with/clear, and clean up global instructions. - Set up RTK. The setup is small and the benefit shows up on large test and
build outputs. Know about
rtk proxyfor debugging. - Test Ponytail on open-ended tasks. In my measurement, 43 percent net savings remained after the skill's own cost. On precisely described tickets, the math can also come out negative.
- Introduce Graphify only with a maintenance plan. For known files, the query was very economical. The index has to stay current and doesn't reliably capture HTTP connections.
The biggest savings in my measurements came from individual cases. For RTK it was a single
git diff accounting for 106,000 of the 149,000 estimated tokens saved. For Graphify
it was a 51 KB file that would otherwise have been read in full. For Ponytail it was an options
modal that the ticket never asked for. Expect savings to be lumpy rather than even.
Calculate net for every tool. In this case Ponytail brought 80 percent less output gross; after the roughly 1,700 tokens for the skill, 43 percent remains. A Graphify query also costs context when it misses the target. RTK reduces tool output; its token figures are an estimate derived from bytes, not a bill from the model provider.
Measure before and after a change, on the tasks your team actually works on. Note the model, tool version, task, and the metric used. Then you can tell whether a tool cuts costs or just redistributes them.
Token costs under control?
I set up Claude Code in development teams, including hooks, skills, and the question of which tasks belong with an agent in the first place. 30-minute intro call, free of charge.